Make your equity curve more predictable
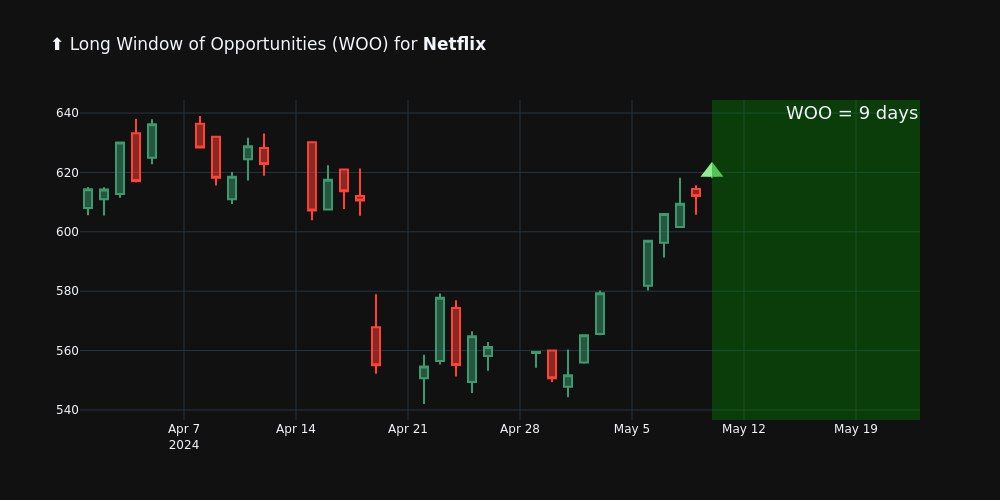
Each idea compliments with entry and exit points both for take profit and stop loss variants
learn more
With OLTO Trading Ideas you can add
value to your portfolio and enter new trades
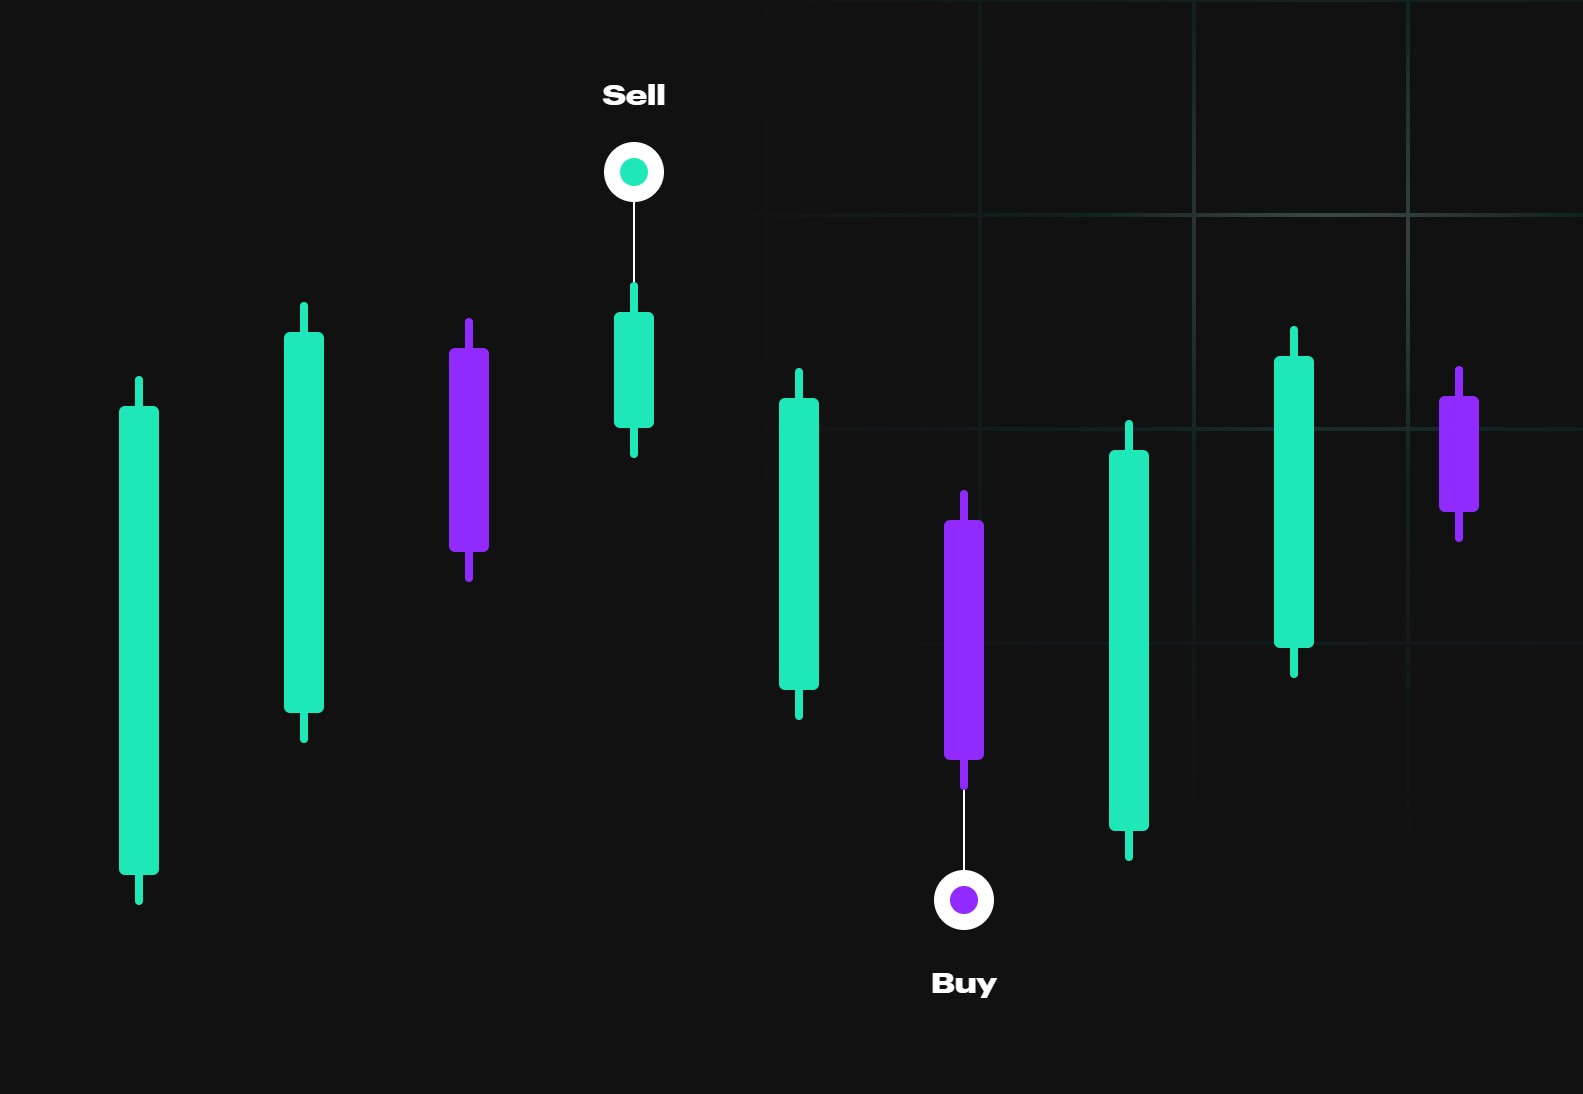
OLTO Trading Ideas can deliver signals across Traditional and Crypto markets on the short- and long-term timeframes
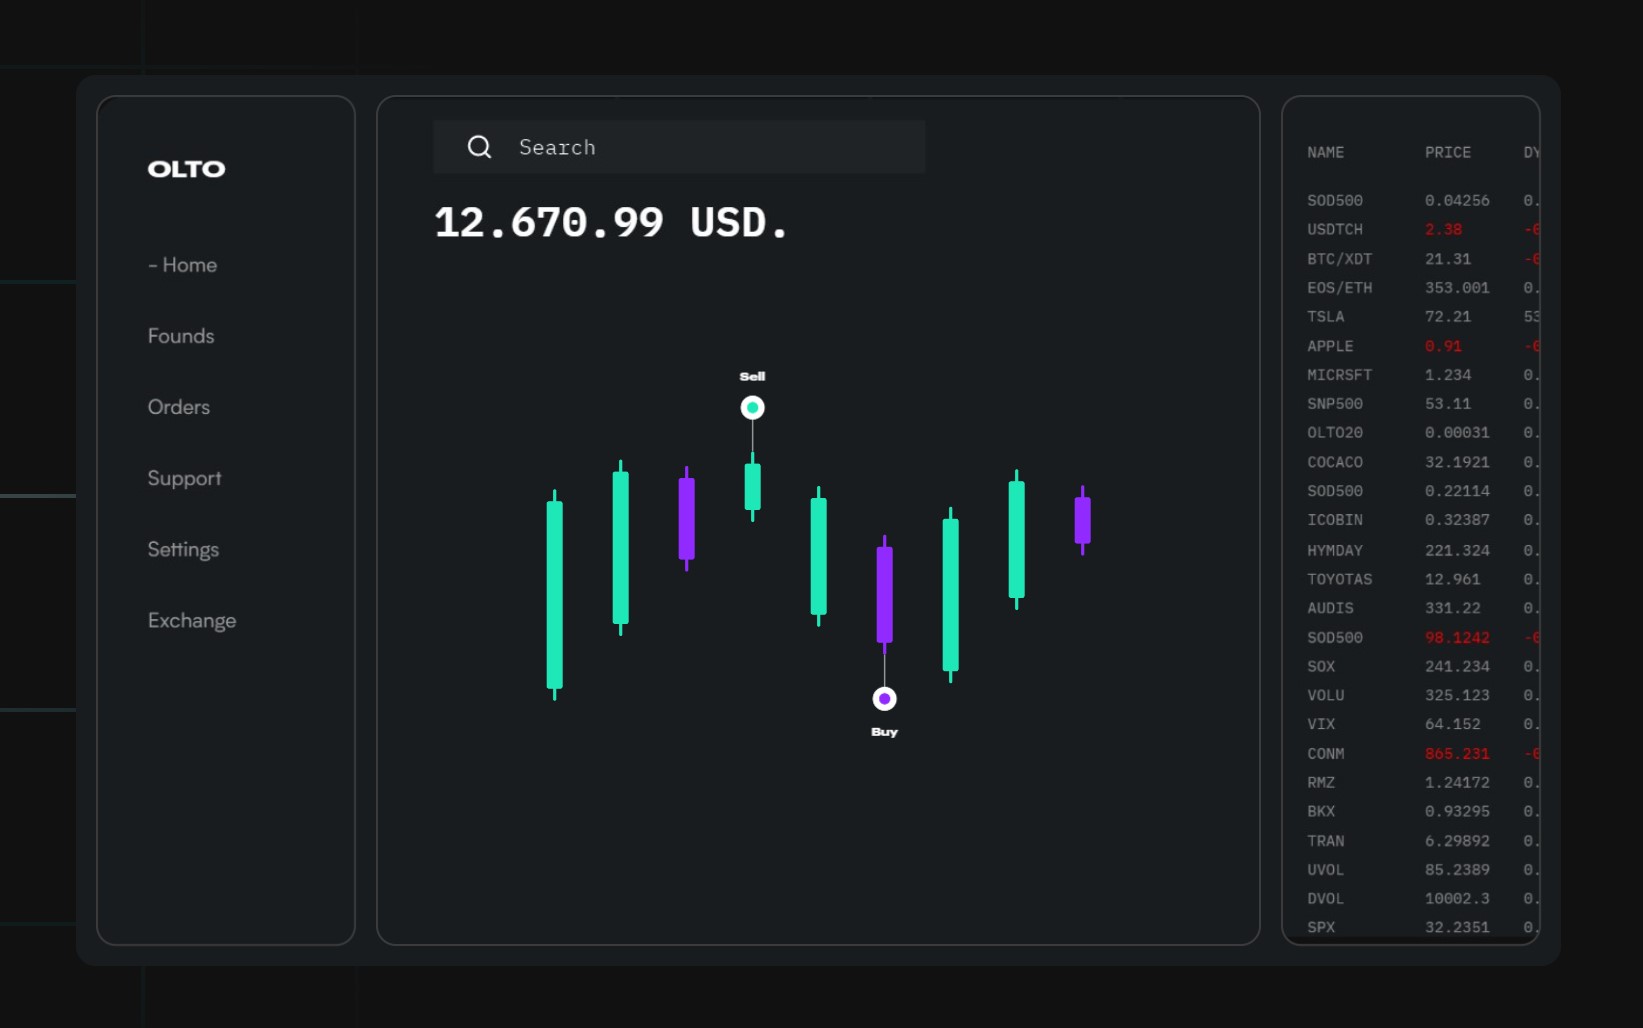
OLTO Risk Mitigator is an easy-to-use tool for mitigating risk with just one click. The service allows traders to survive on the market long-term and maintain full control over their risks.
Each idea compliments with entry and exit points both for take profit and stop loss variants